%20--%3e%3csvg%20version='1.1'%20id='Layer_1'%20xmlns='http://www.w3.org/2000/svg'%20xmlns:xlink='http://www.w3.org/1999/xlink'%20x='0px'%20y='0px'%20viewBox='0%200%20512%20512'%20style='enable-background:new%200%200%20512%20512;'%20xml:space='preserve'%3e%3cpath%20style='fill:%2352BED3;'%20d='M424.901,293.995l6.203,26.083l-12.264,12.264l22.64,50.941c0,0,44.337-0.944,54.714-22.64%20c10.377-21.697,15.801-79.929,15.801-79.929l-76.711-44.337'/%3e%3cpath%20style='fill:%2376D9E5;'%20d='M435.286,236.375l-2.609,14.48l51.657,29.856c0,0-5.424,58.232-15.801,79.929%20c-4.841,10.122-17.073,15.726-28.745,18.826l1.695,3.815c0,0,44.337-0.944,54.714-22.64c10.377-21.696,15.801-79.929,15.801-79.929%20L435.286,236.375z'/%3e%3cpath%20style='fill:%23E24260;'%20d='M387.709,309.704l23.092,56.665c4.608,11.327-1.902,24.116-13.782,27.031%20c-35.255,8.662-83.163,8.516-125.68,2.821c-2.184-0.293-4.368-0.606-6.52-0.93c-6.792-1.014-13.427-2.173-19.811-3.459%20c-18.662-3.751-35.255-8.61-47.856-14.211c-50.939-22.643-154.708-10.376-154.708-10.376L0,324.792%20c0,0,178.072-178.092,254.568-200.401c21.201-8.161,44.231-12.633,68.315-12.633c97.886,0,178.51,73.906,189.116,168.95%20C452.608,275.034,387.709,309.704,387.709,309.704z'/%3e%3cpath%20style='fill:%23CE2647;'%20d='M173.537,324.238c0,0,19.414,52.893,71.471,67.594c-18.662-3.751-35.255-8.61-47.856-14.211%20c-50.939-22.643-154.708-10.376-154.708-10.376L0,324.792c0,0,178.072-178.092,254.568-200.401%20c21.201-8.161,44.231-12.633,68.315-12.633C322.884,111.758,165.679,216.196,173.537,324.238z'/%3e%3cpath%20style='fill:%2349618C;'%20d='M397.019,393.4c-12.57,3.082-26.76,5.057-41.733,6.05h-0.052%20c-55.85,3.72-122.681-6.092-158.083-21.828c-50.939-22.643-154.708-10.376-154.708-10.376L0,324.803%20c0,0,122.629-19.811,200.934,6.593c78.294,26.415,186.775-21.692,186.775-21.692l23.092,56.665%20C415.41,377.695,408.9,390.485,397.019,393.4z'/%3e%3cpath%20style='fill:%233B4773;'%20d='M355.234,399.45c-55.85,3.72-122.681-6.092-158.083-21.828%20c-50.939-22.643-154.708-10.376-154.708-10.376L0,324.803c0,0,122.629-19.811,200.934,6.593%20C200.934,331.396,261.078,399.45,355.234,399.45z'/%3e%3cpath%20style='fill:%2376D9E5;'%20d='M264.819,395.291c2.518,0.188,4.681,0.491,6.52,0.93%20C269.155,395.929,266.971,395.615,264.819,395.291z'/%3e%3cg%3e%3c/g%3e%3cg%3e%3c/g%3e%3cg%3e%3c/g%3e%3cg%3e%3c/g%3e%3cg%3e%3c/g%3e%3cg%3e%3c/g%3e%3cg%3e%3c/g%3e%3cg%3e%3c/g%3e%3cg%3e%3c/g%3e%3cg%3e%3c/g%3e%3cg%3e%3c/g%3e%3cg%3e%3c/g%3e%3cg%3e%3c/g%3e%3cg%3e%3c/g%3e%3cg%3e%3c/g%3e%3c/svg%3e)
User guide
User guide · 1 of 9
Getting started
MyCdA estimates your aerodynamic drag area (CdA) and rolling resistance coefficient (Crr) from rides recorded with a power meter. You ride a test course, upload the file, and MyCdA finds the values that explain your power, speed and elevation. Compare positions, helmets, wheels or clothing on the same course, and see which is faster and by how much.
What CdA and Crr are
At racing speeds most of your power goes into pushing air aside. How much depends on air density, your speed relative to the air, and CdA: your frontal area multiplied by how slippery your shape is, in square metres. A road position is typically 0.30–0.40 m², a good time trial position 0.20–0.25 m², and the very best below 0.20 m².
Crr describes the drag of your tyres on the road. It's small (typically 0.003–0.008) and depends on the tyres, their pressure and the road surface. Rolling resistance doesn't change with speed, while aerodynamic drag grows with its square, which is what lets the two be told apart.
How it works: virtual elevation
MyCdA uses Robert Chung's virtual elevation method. At every second of your ride, the power you put in goes into overcoming air and rolling resistance, speeding up, or climbing. Given your mass, air density, Crr and CdA, whatever power is left over after drag and acceleration must have gone into climbing. Adding those climbs up second by second draws an elevation profile: the virtual elevation.
With the right CdA and Crr, the virtual elevation follows the real road. With the wrong ones it drifts: on a loop or an out and back, the profile doesn't come back to the height it started at.
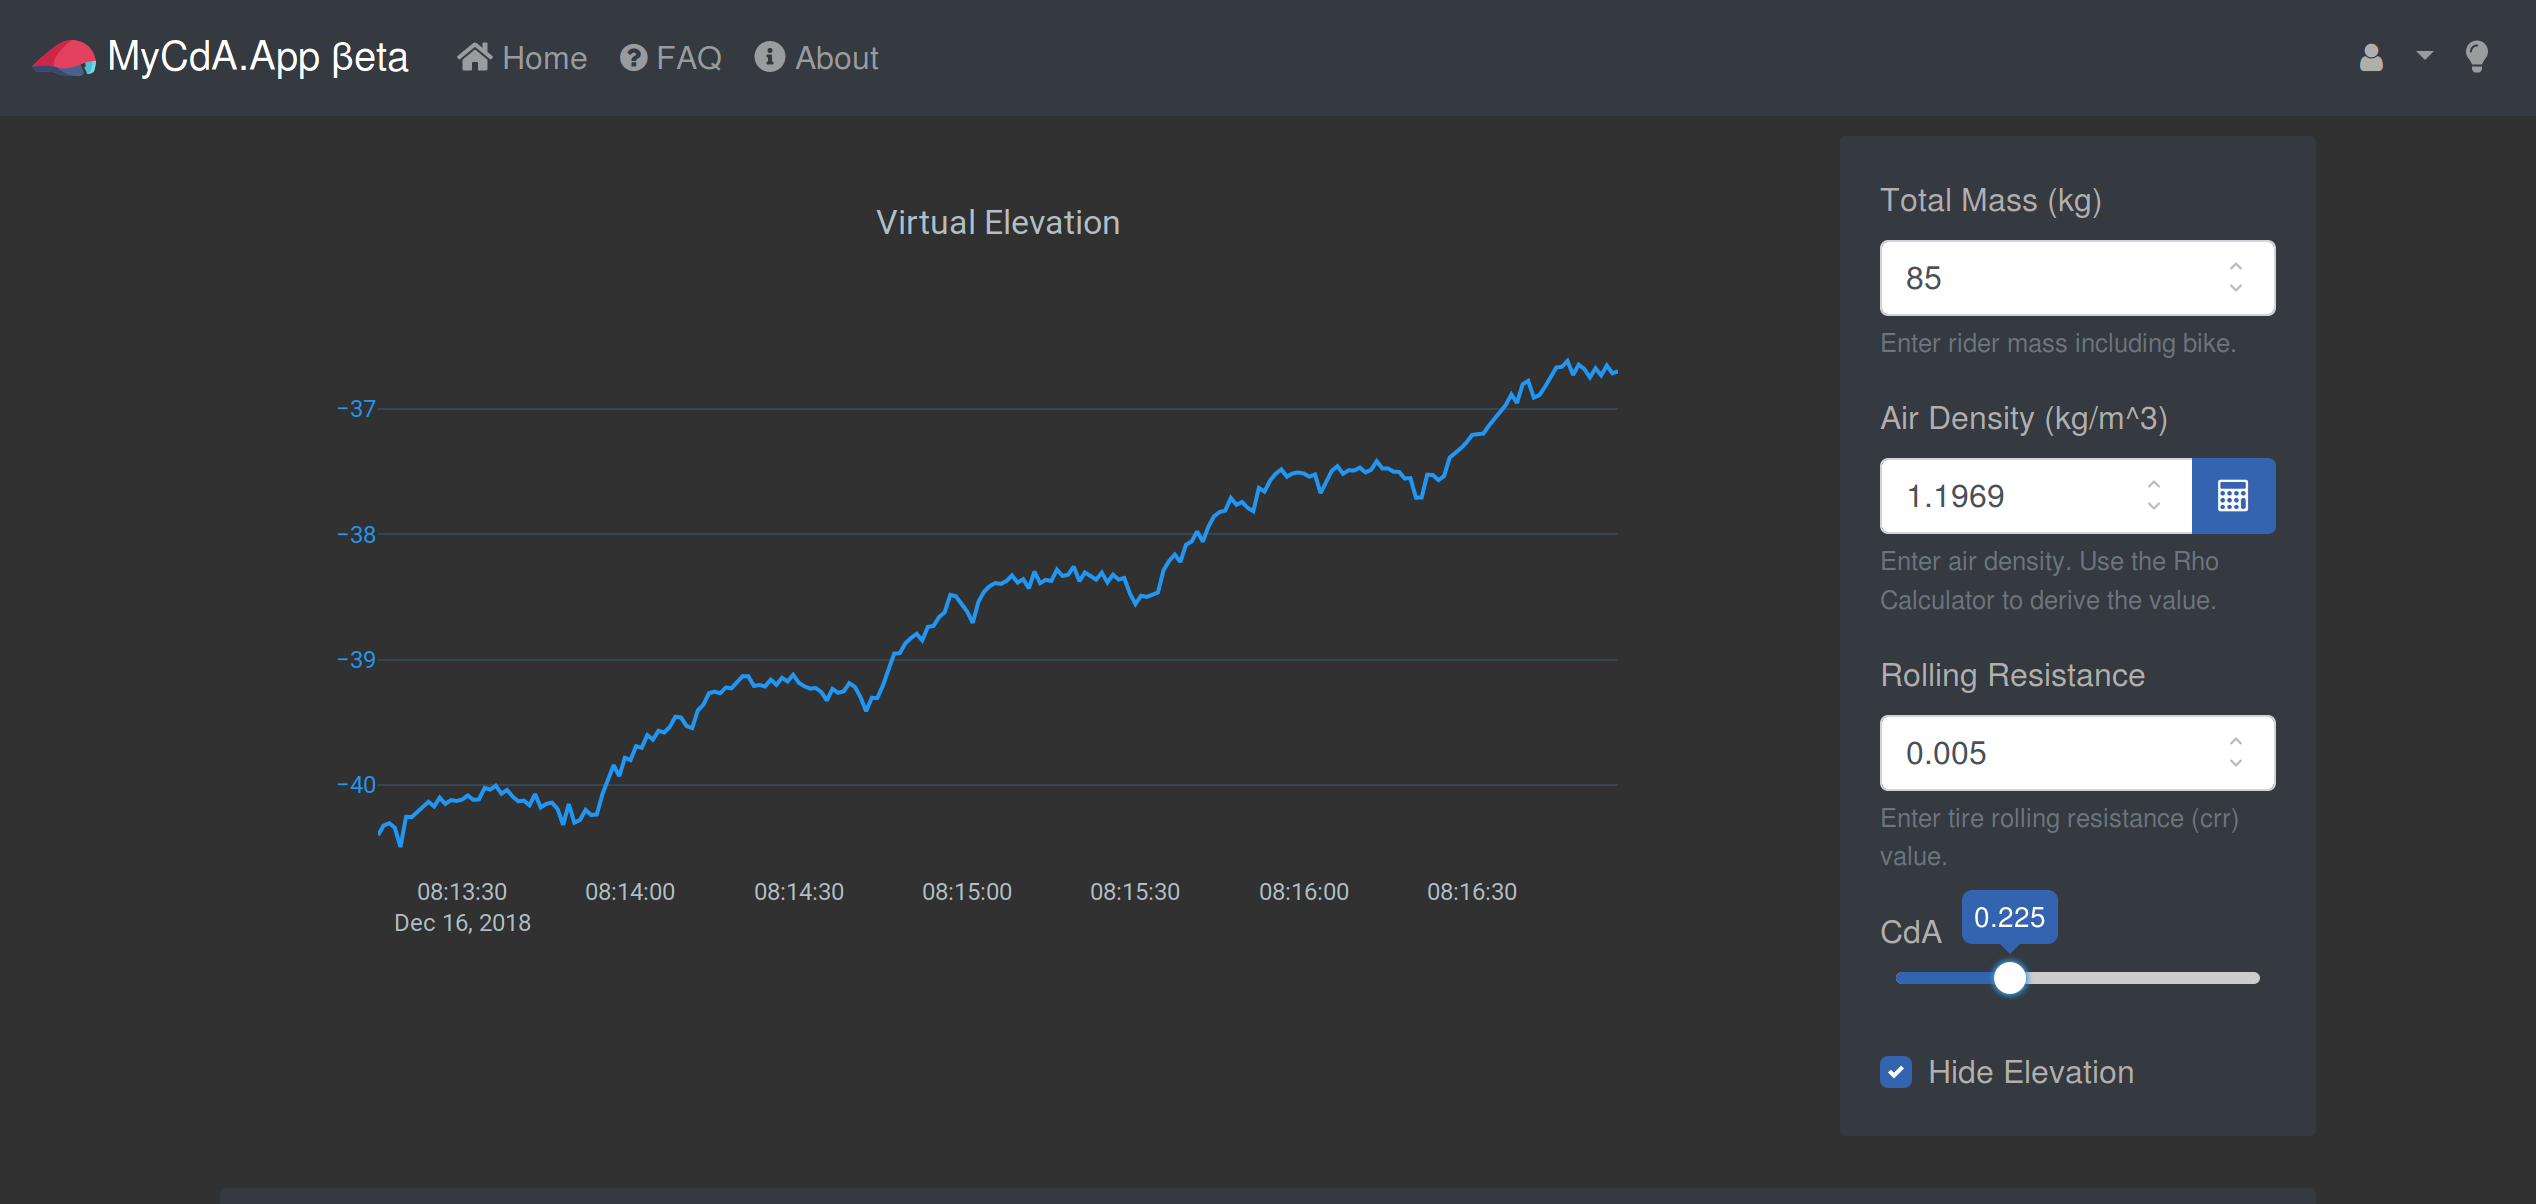
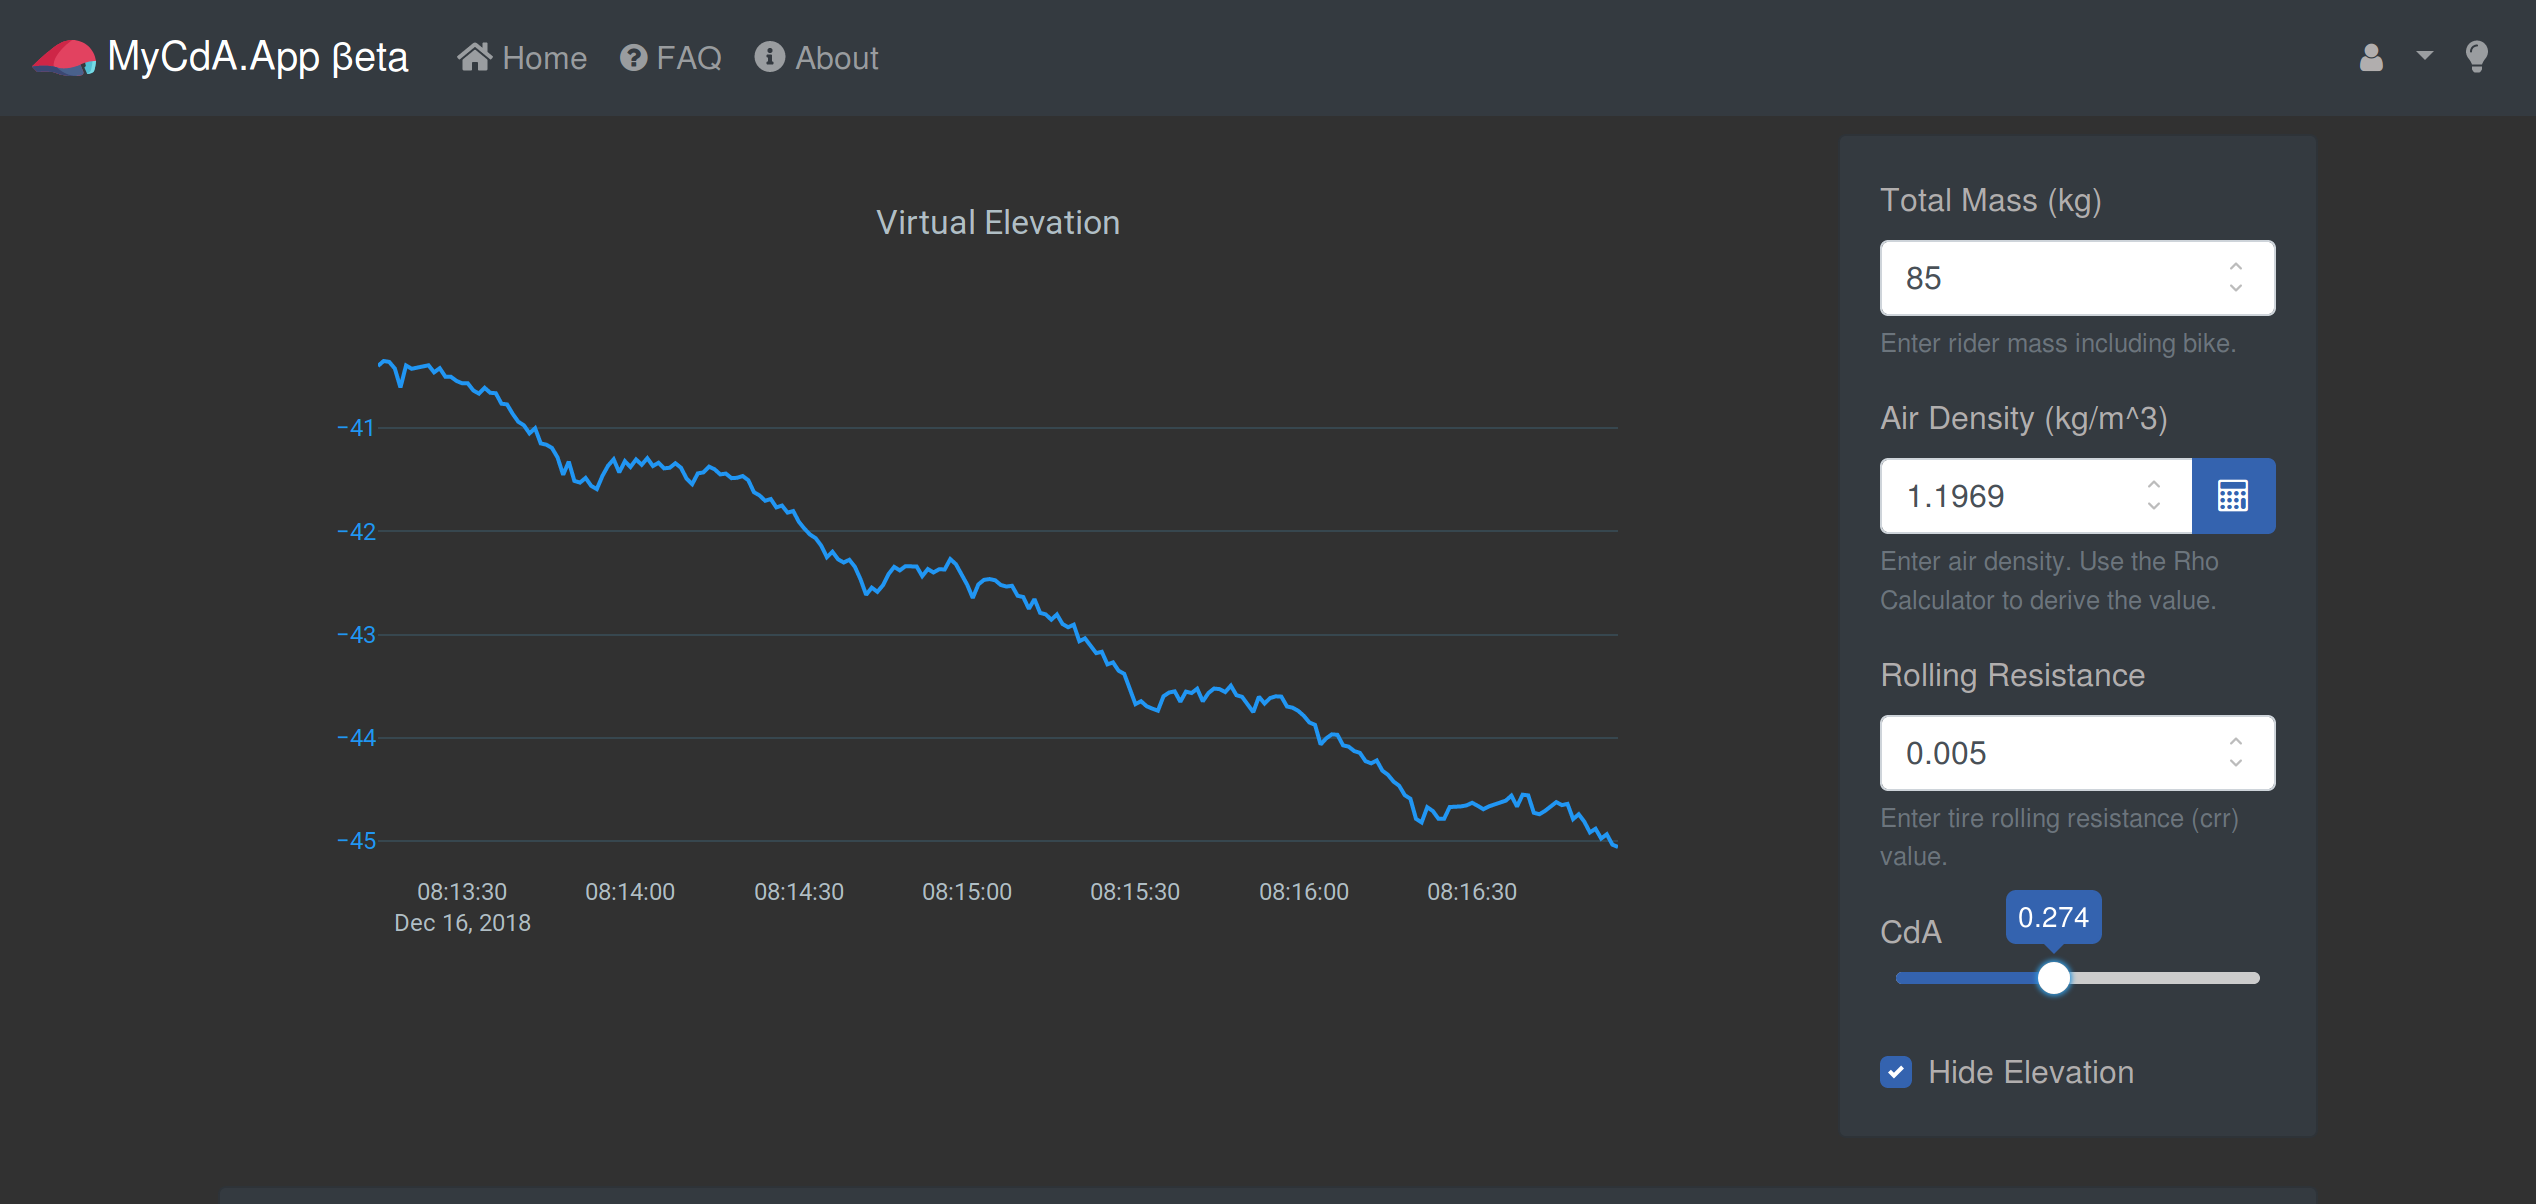
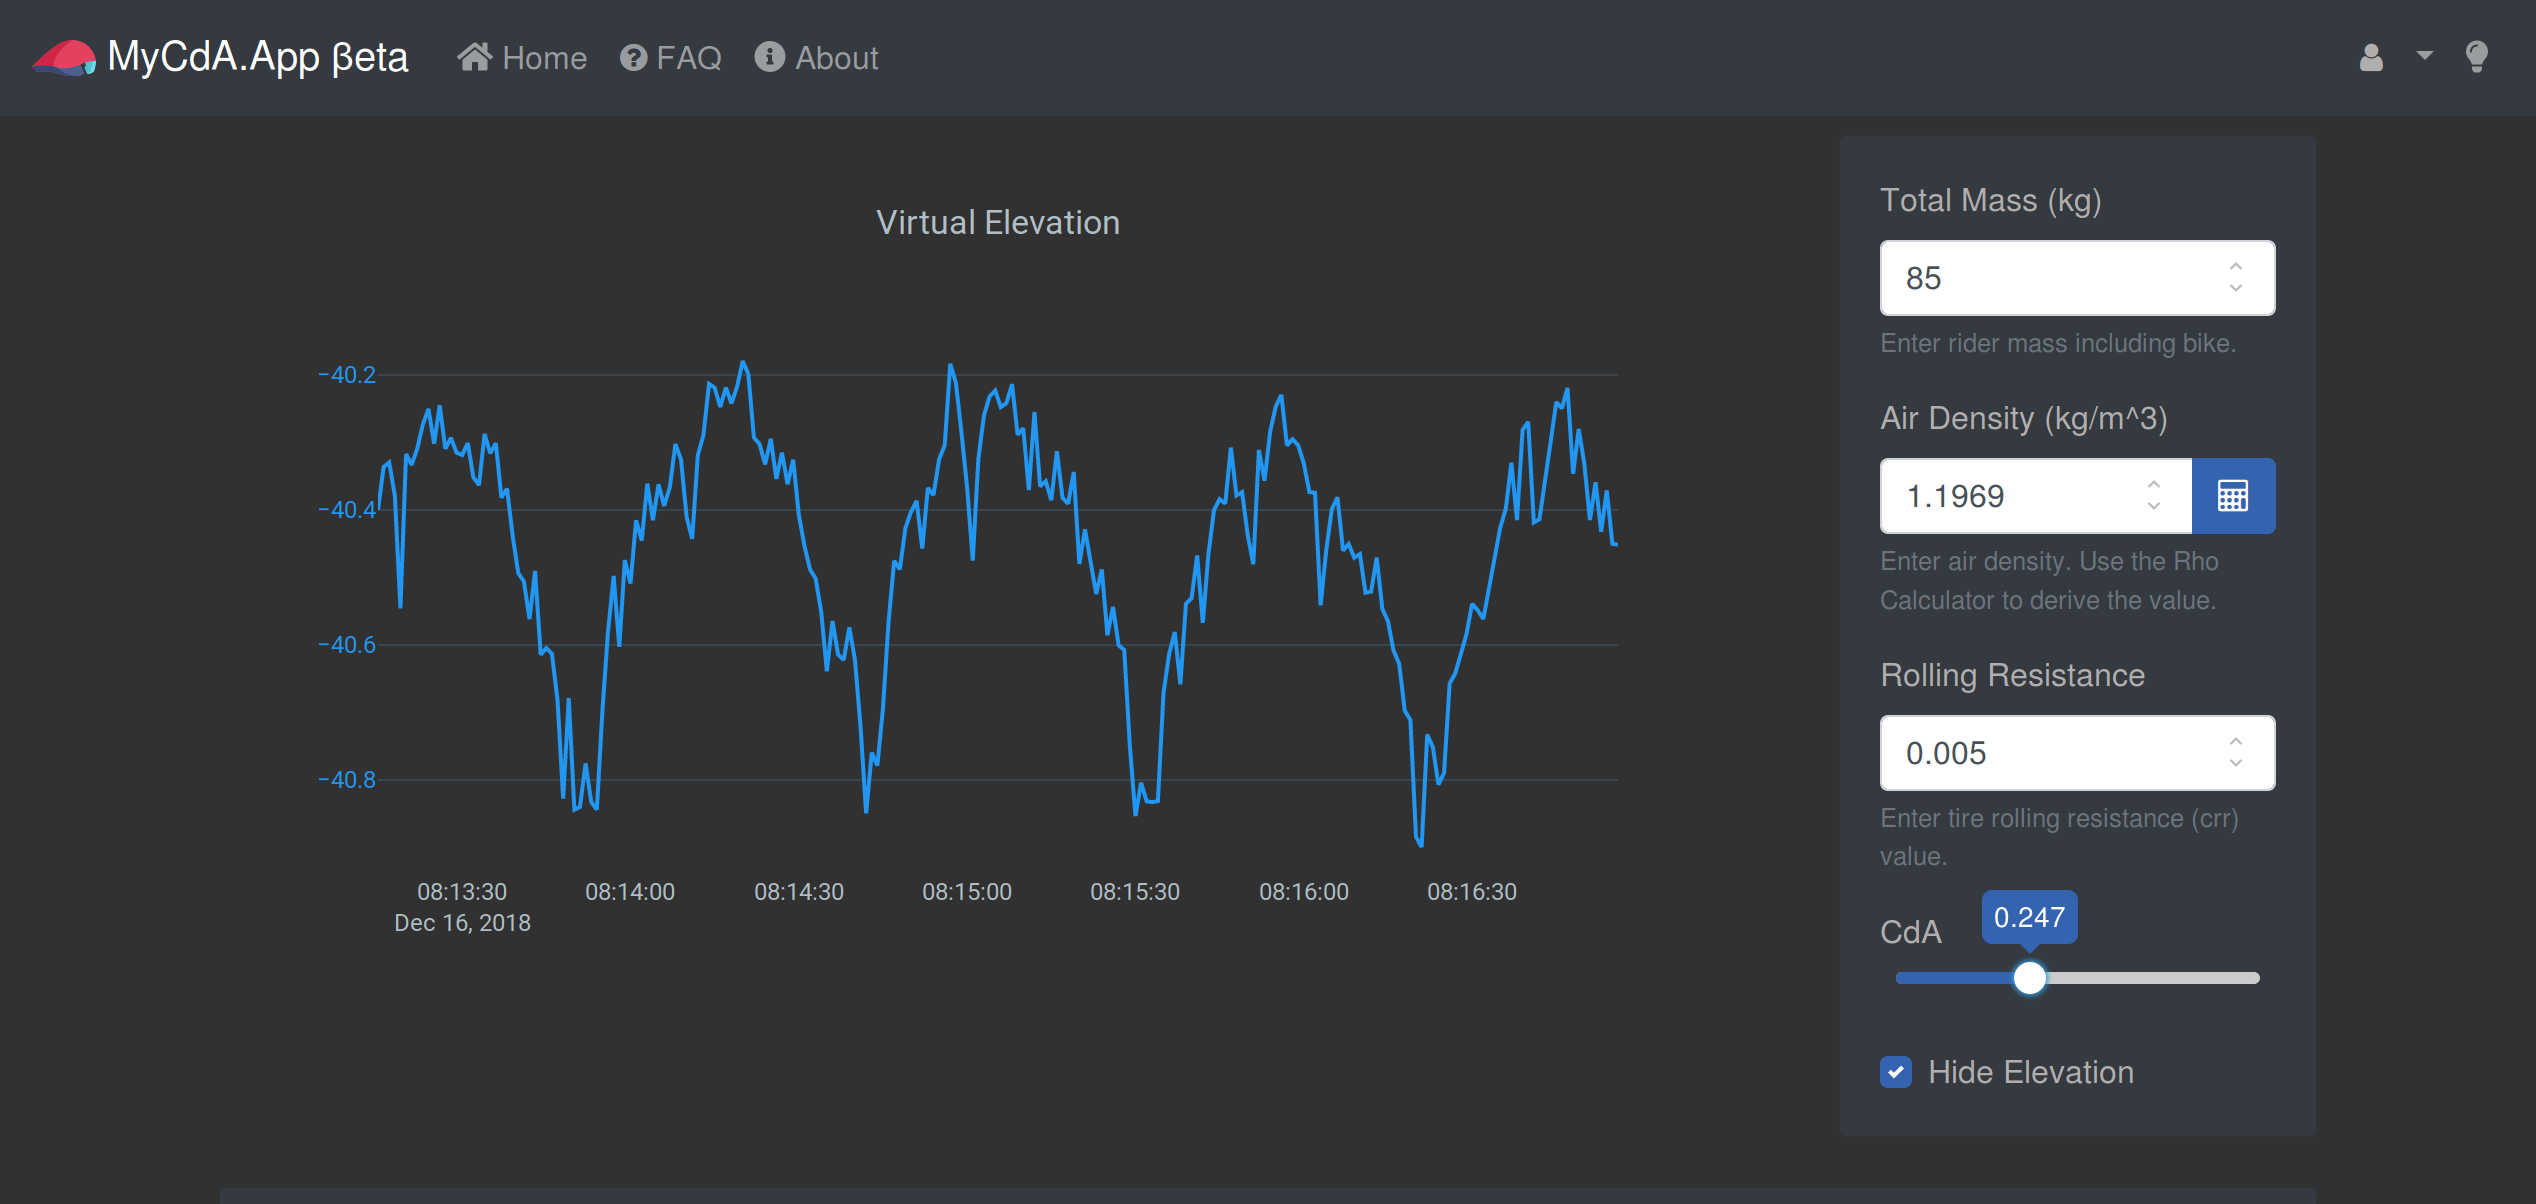
You can adjust CdA by hand until the profile looks right, or let MyCdA find the value that closes the loop. The method needs no wind tunnel and no smooth velodrome, but it does need careful testing: see Collecting test data.
Creating an account
Sign up with an email address and a password. Your rides and analyses are private to your account. You can try the air density calculator without one.
Your profile
After signing up you land on your profile. Its Analysis preferences are the starting values for every new analysis:
| Units | Metric or imperial, for everything the app shows. Values are stored in metric, so you can switch at any time. |
| Rider weight | Including kit, shoes and helmet: weigh yourself dressed to ride. |
| Bike weight | As set up for testing, with bottles, tools and computer. |
| CdA | Your best guess. New analyses fit their own starting CdA, so this mostly matters for the profile check. |
| Crr | 0.005 is a fair start for good tyres on good asphalt. See the profile page for scaling roller test data. |
| Drivetrain loss | Power lost between the power meter and the road: about 1 % for hub meters, 2–4 % for pedal, crank or spider meters, more with a worn or dirty chain. |
The workflow at a glance
- Ride a test course, pressing the lap button at the start and end of each run (Collecting test data).
- Upload the file on the Activities page (Uploading).
- Open it. Enter the ride's conditions in Ride settings (The activity page).
- Check the Tests table: it pairs your out and back runs and fits a CdA for each (The Tests table).
- Open a test to inspect it in detail, and save it (Analyzing a run).
- Compare setups against a baseline (Comparing setups).
The app works on phones too, but the charts are easier to read on a larger screen.
Something missing or unclear? Ask the user community or contact us.